


Amazon Seller Central reports split into four families: Business reports (sales and traffic), Advertising reports (ad performance), Inventory reports (stock in the FBA network), and Payments reports (where the money went). Between them they answer nearly every question about your business, and most sellers open almost none of them. If your account is not set up yet, start with our guide to the Amazon Seller Central account.
I understand why. The reports arrive as dense spreadsheets with inconsistent names, scattered across three menus, and Amazon’s idea of a friendly interface stops at the download button. So this guide is a map: where each report lives, what it actually tells you, which ones deserve a weekly slot, and the six metrics I’d track even if you ignore everything else.
We run Amazon Seller Central reports for client accounts every week. My view is that only a handful of them drive real decisions, and the rest exist mainly to be exported once and forgotten. The recommendations below reflect that split.
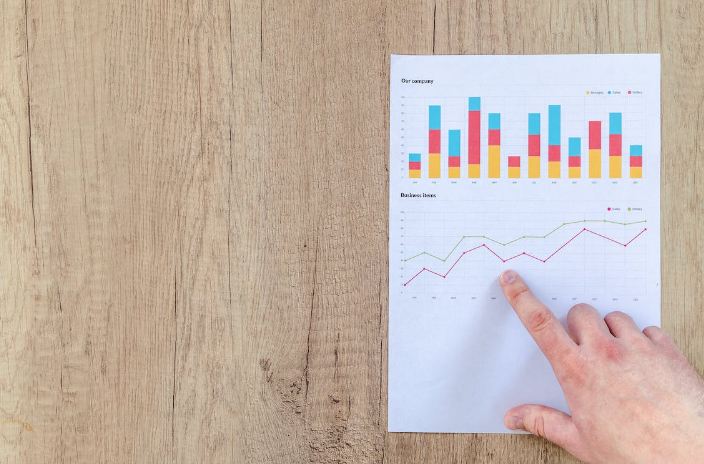
Where Amazon Seller Central reports live
- Business reports: Reports menu, then Business Reports. Sales, traffic and conversion, up to two years back.
- Advertising reports: the Advertising console (Reports section there), covering every ad type you run.
- Fulfillment reports: Reports, then Fulfillment, for All Orders, shipments, returns and the Inventory Ledger.
- Inventory reports: also under the Inventory menu, FBA-focused.
- Payments: Reports, then Payments, for transactions, settlements, and the answer to “why is this disbursement smaller than I expected.”
- Brand Analytics and Search Query Performance: Brands, then Brand Analytics, for brand-registered sellers with the Brand Representative role, and honestly the most underused data in Seller Central.
Access differs by account: some reports are FBA-only, and the Brands family requires Brand Registry.
Business reports explained: every report and what it tells you
Business Reports sit under Reports, then Business Reports. Amazon’s own guide to business reports lists them in two groups, and the names are more specific than most articles use:
| Group | Report | What it answers |
|---|---|---|
| By date | Sales and Traffic | How the whole account did, day by day |
| By date | Detail Page Sales and Traffic | Traffic and conversion on detail pages over time |
| By date | Seller Performance | Order-level health figures over time |
| By ASIN | Detail Page Sales and Traffic | Every product in one table |
| By ASIN | Detail Page Sales and Traffic by Parent Item | Variation families rolled up |
| By ASIN | Detail Page Sales and Traffic by Child Item | Each size, color or variant on its own |
| Other | Sales and Orders by Month | Monthly totals for quick comparisons |
Three facts about them that save confusion. First, Amazon keeps up to two years of Business Reports data, so export anything you want to compare across longer periods. Second, the “by date” reports update hourly and the others daily, which is why a by-ASIN total can lag the account total during the day. Third, columns labeled “B2B” cover Amazon Business customers only, while columns without that label include both business and consumer sales. Don’t add the two together. You will double count.
The columns, in plain terms:
- Sessions: visits to your detail pages within a 24-hour window. One shopper viewing three times in a day is one session.
- Page views: every view, including repeats.
- Units ordered and ordered product sales: demand, before returns and cancellations.
- Unit Session Percentage: units ordered divided by sessions. This is Amazon’s conversion rate, and it can top 100% when shoppers buy several units per visit. I’d treat it as the single most useful column on the page.
- Featured Offer (Buy Box) percentage: the share of page views where your offer was the Featured Offer. Amazon’s interface now says Featured Offer; the underlying data field is still called Buy Box percentage.
The Sales and Traffic report by date is the one I’d make weekly reading, because every problem in the business shows up here first as a moving line.
The by Child Item report is where you diagnose: which variant lost sessions, which one’s conversion sagged, which quietly became your bestseller. Account totals hide all three, and in our experience the per-product drilldown is where the fixable problems live.
Sales and traffic by SKU: how to get it
A frequent search, and the answer is slightly awkward. The Seller Central screens report by parent and child ASIN, not by SKU. If you sell one SKU per ASIN, the Child Item report is your SKU view and nothing more is needed.
If several SKUs share an ASIN, such as an FBA and a merchant-fulfilled offer on the same product, the screens merge them. Amazon’s Selling Partner API offers the same Sales and Traffic report at three levels, parent, child or SKU, by day, week or month, according to its analytics report documentation. Most reporting tools and connectors use that API, so a SKU-level view is one connector away. I’d only pay for that if the merged figures are actually hiding a decision. Most of the time they aren’t.
Fulfillment reports: orders, shipments and returns
These sit under Reports, then Fulfillment, not under Business Reports. Easy to mix up. I think the menu names are half the problem.
All Orders (Reports, then Fulfillment, then All Orders): a flat export of every order in a date range. You request the report, choose Order Date or Last Updated Date, and download when it is ready. It is the raw material for any analysis Amazon’s interface will not do for you.
Customer Shipments and Customer Returns. Order-level FBA data, and the returns report deserves more respect than it gets: return reasons per ASIN are free product feedback, and a rising return rate flags a listing-versus-product gap before the reviews do.
Subscribe and Save. Situational: essential if you run Subscribe and Save, skippable otherwise. Amazon Business (B2B) sales do not need a separate report; they appear in the B2B columns of the Sales and Traffic reports.
Advertising reports: where the money leaks show
The console reports cover Sponsored Products, Sponsored Brands (including video), display ads (Amazon’s 2026 name for Sponsored Display), DSP if you use it, and Brand Store traffic. Amazon defines the search term report as the terms that led to at least one click, so impressions without clicks do not appear there. Export it regularly, because the console does not keep every report history indefinitely.
One report towers over the rest: the Search Term Report for Sponsored Products. It shows the real queries that triggered your ads, with spend and sales attached, and it feeds the two highest-value recurring tasks in Amazon advertising: harvesting converting queries into your listings and exact-match campaigns, and cutting non-converting queries as negatives. That loop is the core of our monthly ad workflow, and the full method is in our search term optimization guide.
Also worth a monthly look: placement reports (are you overpaying for top-of-search?), and advertised product reports (which ASINs the budget actually flows to). If reading these regularly sounds like a job, it is; it is a substantial part of what managed advertising costs, and we priced that question honestly in our PPC management cost guide.
Inventory reports: the FBA control panel
The inventory reports changed more than any other family, and many guides still describe reports that no longer exist. On January 31, 2023, Amazon retired Daily Inventory History, Monthly Inventory History, Received Inventory, Inventory Event Detail, Inventory Adjustments and Inventory Reconciliation, and replaced all six with the Inventory Ledger, announced on the Seller Central forums. If a guide tells you to open Daily Inventory History, it is out of date. Skip it.
The Inventory Ledger has a Summary view (starting balance, receipts, shipments, returns, adjustments and ending balance per FNSKU, by month or day) and a Detailed view (every individual event). It is the report that matters most for reimbursement work, because it shows exactly where a unit went. When you file a claim, I’d attach the Ledger rows rather than describe them.
The others worth regular attention:
- FBA Inventory: per-ASIN quantities by condition and disposition. Your live stock truth.
- Inventory Age: how long stock has sat, and your early warning for aged-inventory surcharges, which start at 181 days. Check it before the fee does.
- Restock Inventory: Amazon’s restock suggestions and limits. Imperfect, but the fastest stockout-risk scan available.
- Reserved Inventory: units in transfer between fulfillment centers or attached to pending orders. This is usually the answer to “where did 40 units go?”, and knowing that saves a support case.
- Monthly Storage Fees: fee calculation per ASIN. Read alongside Inventory Age each quarter to decide what to liquidate, and read it twice before Q4 rates hit.
Discrepancies in the Ledger (received versus sent, lost or damaged in the network) are exactly what FBA reimbursement recovery runs on. Since March 31, 2025, Amazon reimburses lost FBA units at their sourcing cost rather than their sale price, so the Ledger evidence matters more than it did.
Brand reports: the unfair advantage
Brand-registered sellers with the Brand Representative role and a Professional plan get Brand Analytics (Top Search Terms with each term’s Search Frequency Rank and its top three clicked products, demographics, market basket) and the Search Query Performance dashboard (your products’ impressions, clicks, cart adds and purchases per real query, plus search query volume). This is first-party demand data that third-party tools can only estimate. If you qualify and have never opened these, I’d start there before anything else in this article.
The six metrics to watch weekly
If the report jungle overwhelms, track these and you will catch most problems early:
- Units ordered: the raw pulse.
- Total sales: with price changes factored in.
- Sessions: traffic. Falling sessions is a visibility problem (keywords, rank, ads).
- Page views per session: comparison-shopping behavior worth noticing.
- Unit session percentage: your conversion rate, the single most diagnostic number per ASIN. Falling conversion at flat traffic means the page, price, reviews, or a competitor changed.
- Featured Offer (Buy Box) percentage: below about 90% on your own private-label listings means suppression, pricing, or a hijacker, and it explains “my ads stopped” more often than anything in the ad console.
The habit that makes these useful is consistency: same day each week, same spreadsheet, so trends surface. A number without its trend is trivia. My own rule is Monday morning, before anything else gets opened.
A simple weekly workflow that combines them
Here is the 30-minute routine we run on client accounts, in order:
- Open Sales and Traffic by date. Scan the week against the prior four. Anything moved more than about 15%? Note it.
- Drill into Sales and Traffic by Child ASIN for whatever moved. Sessions down points to visibility (check rank, ads, suppression). Conversion down points to the page (check price, reviews, a new competitor, Featured Offer percentage).
- Pull the Search Term Report if ad spend shifted. Harvest converting queries, add negatives for the bleeders.
- Scan Restock and Inventory Age. Anything at stockout risk inside your lead time gets reordered now, not next week; anything aging toward a surcharge gets a decision.
- Glance at Payments. Confirm the settlement matches expectations, because fee surprises and reimbursement candidates both hide here.
Five reports, one pass. In my view it catches most of what a paid dashboard subscription would. The paid tools win on convenience and history, not on information, because they read the same Amazon data.
FAQ
What are Amazon Seller Central reports?
Built-in data exports covering sales and traffic (Business reports), advertising performance, FBA inventory, and payments. They live under the Reports and Inventory menus, with brand-level analytics under Brands for registered sellers.
How do I download the All Orders report?
Go to Reports, then Fulfillment, then All Orders, choose Order Date or Last Updated Date and a date range, request the report, and download it when it is ready. It lists every order in the period and is the base file for most custom analysis.
How far back do Amazon business reports go?
Amazon keeps up to two years of Business Reports data. The by-date reports update hourly and the others daily, so export anything you want to compare over longer periods.
How do I see sales and traffic by SKU on Amazon?
Seller Central shows Sales and Traffic by parent and child ASIN, which equals a SKU view when each ASIN has one SKU. For true SKU-level figures, Amazon’s Selling Partner API offers the same report at SKU granularity, which most reporting tools use.
Which Amazon report shows my conversion rate?
The Sales and Traffic Business report, as Unit Session Percentage: units ordered divided by sessions. The Detail Page Sales and Traffic by Child Item report shows it per product, which is where conversion problems actually get diagnosed.
What is the most important advertising report?
The Sponsored Products Search Term Report. It reveals the real customer queries behind your ad spend, which queries convert, and which waste budget, feeding both your negative keywords and your listing’s keyword targeting.
What reports do brand-registered sellers get?
Brand Analytics (Top Search Terms with click share, demographics, market basket analysis) and the Search Query Performance dashboard showing your impressions, clicks, cart adds and purchases per query. Access needs Brand Registry, the Brand Representative role and a Professional plan.
Why is my available inventory lower than what I shipped?
Check the Reserved Inventory report first: units in transfer between fulfillment centers or tied to pending orders show as reserved, not available. Then trace the rest in the Inventory Ledger. Genuine discrepancies that persist belong in a reimbursement review, since Amazon compensates for inventory lost or damaged in its network.
Last updated: October 25, 2026. Updated with Amazon’s current Business Reports list, the two-year data limit, the Inventory Ledger that replaced six reports in 2023, and the Featured Offer and display ads naming. Report names and menu locations shift as Amazon reorganizes Seller Central; the Reports and Brands menus carry the current versions.