Every Amazon seller wants more sales, better rankings, and a competitive edge. But the real winners on Amazon aren’t just the ones with great products—they’re the ones who understand customer behavior and market trends better than their competitors.
That’s where Amazon Brand Analytics (ABA) comes in. In this article, you’ll know exactly how to use Amazon Brand Analytics to optimize your listings, fine-tune advertising, and boost sales.
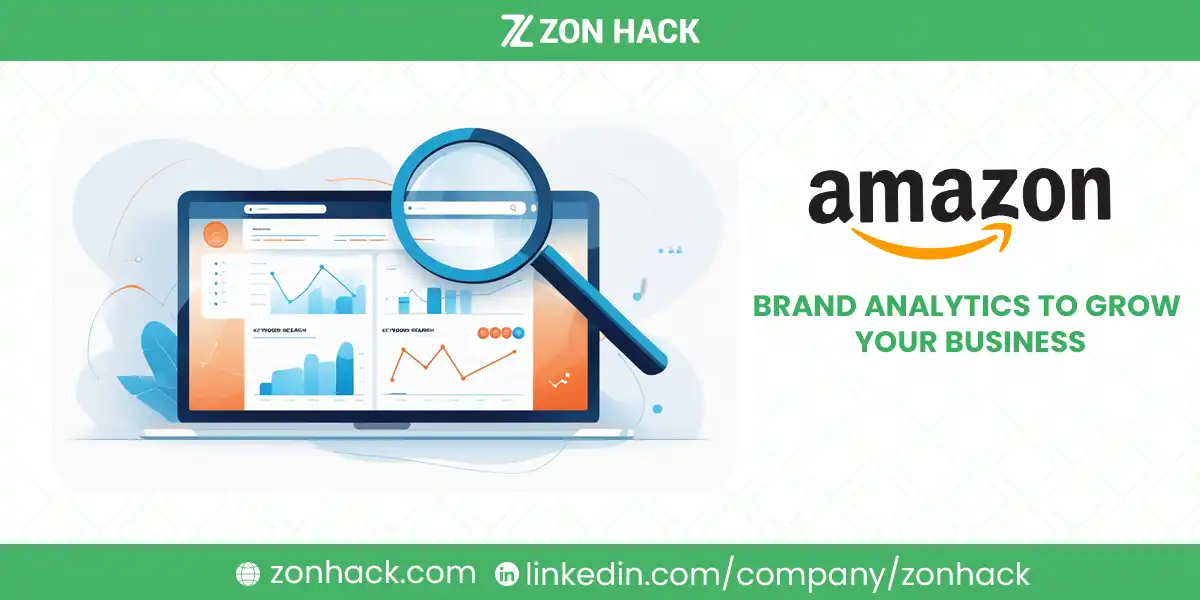
And if you need help extracting real insights from the data, ZonHack can take care of the heavy lifting—helping sellers turn raw analytics into a winning Amazon strategy.
What Is Amazon Brand Analytics?
Amazon Brand Analytics is a free tool for brand-registered sellers, providing deep insights into:
- What customers search for before buying.
- How your products rank against competitors.
- Demographic details about your buyers.
- Which products get repeat purchases.
Think of it as Amazon’s secret playbook—except it’s available to every brand-owner willing to use it.
You can find it inside Seller Central → Brands → Brand Analytics. If you don’t see it, your brand might not be registered yet.
The reports inside fall into two categories:
- Search Analytics – Focuses on customer searches and how well your products perform in them.
- Consumer Behavior Analytics – Helps you understand your buyers, their demographics, and their purchasing habits.
Used correctly, these reports can transform your strategy, helping you rank higher, target better keywords, and outsmart the competition.
How to Use Amazon Brand Analytics to Increase Sales
Let’s break it down step by step.
1. Find and Rank for the Best Keywords (Search Query Performance Report)
One of the most powerful features of ABA is the Search Query Performance Report. This report tells you:
- Which search terms bring shoppers to your listings.
- Your share of clicks and purchases for each keyword.
- How your competitors perform on the same keywords.
For example, imagine you sell wireless earbuds. You check your Search Query Performance Report and see that “Bluetooth earbuds” is a top search term, but your click share is only 5%.
That means shoppers are seeing your product but clicking on competitors instead.
What should you do?
- Optimize your title and bullet points to better match the keyword.
- Improve your main image to stand out in search results.
- Increase your ad spend on that keyword to get more visibility.
By doing this, you can capture a bigger share of the clicks and sales.
However, analyzing keyword performance manually takes time. ZonHack’s Amazon optimization service can help by identifying high-potential keywords and improving your organic rankings and ad performance.
2. Understand Customer Behavior (Search Catalog Performance Report)
Knowing which keywords bring traffic is great. But what happens after customers land on your page?
That’s where the Search Catalog Performance Report comes in.
It shows you the full customer journey, including:
- How often people see your product (impressions).
- How many click on it (click-through rate).
- How many add it to their cart (add-to-cart rate).
- How many actually buy it (conversion rate).
Let’s say you’re getting a high number of clicks but low conversions. That’s a red flag.
Possible reasons:
- Your price is too high compared to competitors.
- Your product has poor reviews.
- Your listing is missing key information buyers need.
By identifying where customers drop off, you can fix the weak points in your funnel and improve conversions.
If you’re struggling with conversion rates, ZonHack’s listing optimization service can help fine-tune your product pages, ensuring they are keyword-rich, persuasive, and conversion-friendly.
3. Spy on Competitor Activity (Top Search Terms Report)
Amazon’s Top Search Terms Report lets you see:
- The most searched keywords on Amazon.
- Which brands rank highest for those terms.
- Search volume trends over time.
This is where you can spot rising trends before your competitors do.
Example: If you notice “ergonomic office chair” climbing the search rankings, but it’s not yet ultra-competitive, that’s a golden opportunity to launch a new product or optimize your existing one for that keyword.
It’s also a great way to find seasonal trends. If you see an increase in searches for “waterproof hiking boots” before spring, you can adjust inventory and advertising budgets accordingly.
4. Identify Your Most Loyal Customers (Repeat Purchase Behavior Report)
Do your customers buy once and disappear? Or do they come back for more?
The Repeat Purchase Behavior Report answers this by showing:
- How often customers reorder your products.
- The time gap between purchases.
- Which products get the most repeat buyers.
If you sell consumables like coffee, supplements, or pet food, this data is invaluable.
Let’s say your average customer reorders every 45 days. You can:
- Offer discounts on subscriptions (Subscribe & Save).
- Send follow-up emails reminding them to reorder.
- Create a bundle deal to increase order value.
ZonHack can help analyze reorder patterns and set up automated marketing strategies to keep customers coming back.
Bottom Line: Why Amazon Brand Analytics & ZonHack Are a Powerful Combination
Amazon Brand Analytics is a must-use tool for every brand-registered seller. It provides critical insights, but data alone isn’t enough. You need the right strategy to turn that data into sales.
That’s where ZonHack comes in.
- Need help with keyword ranking? ZonHack has you covered.
- Struggling with conversion rates? ZonHack optimizes your listings.
- Want to dominate PPC? ZonHack fine-tunes your ad strategy.
Instead of spending hours analyzing reports, let ZonHack’s experts handle it—so you can focus on growing your brand.
Ready to maximize your Amazon sales? Get a free consultation with ZonHack today!